Project 1: Image Filtering and Hybrid Images
CS 342: Computer Vision
Brief
- Due: 03-Feb-2020 at 11:59 PM
- Project materials:
proj1.zip. - Turn In: through Google Classroom
- Required files: submission.zip
Overview
The goal of this assignment is to write an image filtering function and use it to create hybrid images using a simplified version of the SIGGRAPH 2006 paper by Oliva, Torralba, and Schyns. Hybrid images are static images that change in interpretation as a function of the viewing distance. The basic idea is that high frequency tends to dominate perception when it is available, but, at a distance, only the low frequency (smooth) part of the signal can be seen. By blending the high frequency portion of one image with the low-frequency portion of another, you get a hybrid image that leads to different interpretations at different distances.
Setup
- Run the notebook using:
jupyter notebook ./code/proj1.ipynb - Generate the submission once you've finished the project using:
python zip_submission.py
Details
This project is intended to familiarize you with Python and image filtering. Once you have created an image filtering function, it is relatively straightforward to construct hybrid images. If you don't already know Python, you may find this resource helpful. If you are more familiar with Matlab, this guide is very helpful.
Image Filtering. Image filtering (or convolution) is a fundamental image processing tool.
See chapter 3.2 of Szeliski and the lecture materials to learn about image filtering (specifically linear filtering).
You will be writing your own function to implement image filtering from scratch. More specifically, you will implement
my_imfilter() which imitates the filter2D function in the OpenCV library. As specified in student_code.py, your filtering algorithm must (1) support grayscale and color images (2) support arbitrary shaped filters, as long as both dimensions are odd (e.g. 7x9 filters but not 4x5 filters) (3) pad the input image with zeros or reflected image content and (4) return a filtered image which is the same resolution as the input image. We have provided an iPython notebook, proj1_test_filtering.ipynb, to help you debug your image filtering algorithm.
Hybrid Images. A hybrid image is the sum of a low-pass filtered version of the one image and a high-pass filtered version of a second image.
There is a free parameter, which can be tuned for each image pair, which controls how much high frequency to remove from the first image and how much low frequency to leave in the second image.
This is called the "cutoff-frequency". In the paper it is suggested to use two cutoff frequencies (one tuned for each image) and you are free to try that, as well.
In the starter code, the cutoff frequency is controlled by changing the standard deviation of the Gausian filter used in constructing the hybrid images.
You will implement create_hybrid_image() according to the starter code in student_code.py. Your function will call my_imfilter() to create low and high frequency images and then
combine them into a hybrid image.
We provide you with 5 pairs of aligned images which can be merged reasonably well into hybrid images. The alignment is important because it affects the perceptual grouping (read the paper for details). We encourage you to create additional examples (e.g. change of expression, morph between different objects, change over time, etc.). See the hybrid images project page for some inspiration. The project page also contains materials from their SIGGRAPH presentation.
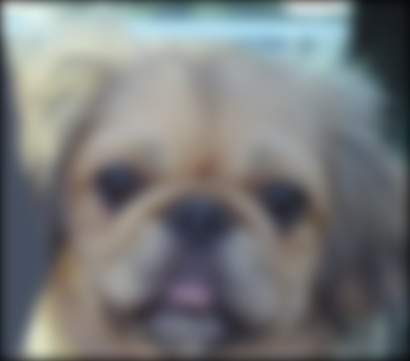
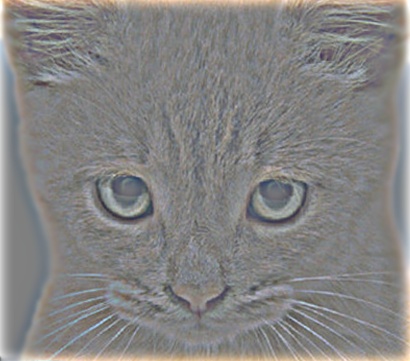
For the example shown at the top of the page, the two original images look like this:


The low-pass (blurred) and high-pass versions of these images look like this:
The high frequency image is actually zero-mean with negative values so it is visualized by adding 0.5. In the resulting visualization, bright values are positive and dark values are negative.
Adding the high and low frequencies together gives you the image at the top of this page. If you're having trouble seeing the multiple interpretations of the image, a useful way to visualize the effect is by progressively downsampling the hybrid image as is done below:
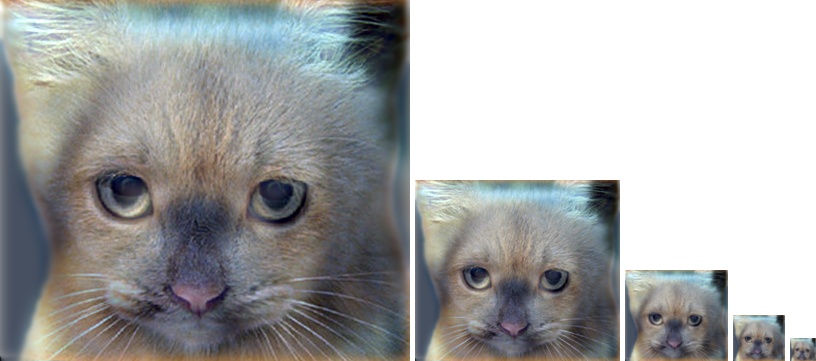
The starter code provides a function vis_hybrid_image in utils.py which can be used to save and display such visualizations.
Potentially useful NumPy (Python library) functions: np.pad(), which does many kinds of image padding for you, np.clip(), which 'clips' out any values in an array outside of a specified range, np.sum(), and np.multiply(), which makes it efficient to do the convolution (dot product) between the filter and windows of the image. Documentation for numpy can be found here or by googling the function in question.
Forbidden functions (you can use these for testing, but not in your final code): anything in OpenCV, and anything that takes care of the filtering operation for you. If it feels like you're sidestepping the work, then it's probably not allowed. Ask the TAs if you have any doubts.
Editing Code: You can use any method you want to edit the student_code.py file.
You may use a simple text editor like Sublime Text,
an IDE like PyCharm, or even just editing the code in browser from the iPython notebook home page. Google "Python editor" to find a litany of additional suggestions.
Writeup
For this project, and all other projects, you must do a project report. The project report should look professional. I highly recommend using Latex for writing the report. In the report you will describe your algorithm and any decisions you made to write your algorithm a particular way. Then you will show and discuss the results of your algorithm. In the case of this project, show the results of your filtering algorithm (the test script saves such images already) and show some of the intermediate images in the hybrid image pipeline (e.g. the low and high frequency images, which the starter code already saves for you). Also, discuss anything extra you did. Feel free to add any other information you feel is relevant. A good writeup doesn't just show results, it tries to draw some conclusions from your experiments.
Rubric
- +50 pts: Working implementation of image filtering in
my_imfilter() - +30 pts: Working hybrid image generation in
create_hybrid_image() - +20 pts: Project report with several examples of hybrid images.
- -5*n pts: Lose 5 points for every time you do not follow the instructions for the hand in format
Handing in
This is very important as you will lose points if you do not follow instructions. Every time after the first that you do not follow instructions, you will lose 5 points. The folder you hand in must contain the following:
- code/ - directory containing all your code for this assignment
- results/ - directory containing your results (generated by the notebook) and your REPORT. The report should be submitted in PDF format.
Do not use absolute paths in your code (e.g. /user/abc/classes/CompVision/proj1). Your code will break if you use absolute paths and you will lose points because of it. Simply use relative paths as the starter code already does. Do not turn in the /data/ folder unless you have added new data.
Hand in your project as a zip file through Google Classroom. You can create this zip file using python zip_submission.py.
Credits
Assignment developed by Samarth Brahmbhatt, Sean Foley, and James Hays based on a similar project by Derek Hoiem.